Recently acquired Dr. Kraft’s excellent book: ‘Diabetes Epidemic & You’ – (Kindle version)thanks to George Henderson and Grant Schofield for switching me on to this. What a guy – see his pedigree here. Essentially he has decoded the hyperinsulinemia mess in society, unveiling the true extent. As we know, Fasting Glucose, Fasting Insulin and general measures of hyperinsulinemia track with atherosclerotic vascular disease (and other types of heart disease to be honest) – but not as much as one would expect – they are noisy variables. Proinsulin (good predictor of Hyperinsulinemic physiology) and direct measures of hyperinsulinemia/diabetes like Kraft’s, are the real trackers. This book indicates why that is. Measuring the WRONG metrics has its consequences. It has led to an almost-criminal underestimation of Insulin issues as the primary driver for Vascular Disease, bar none.
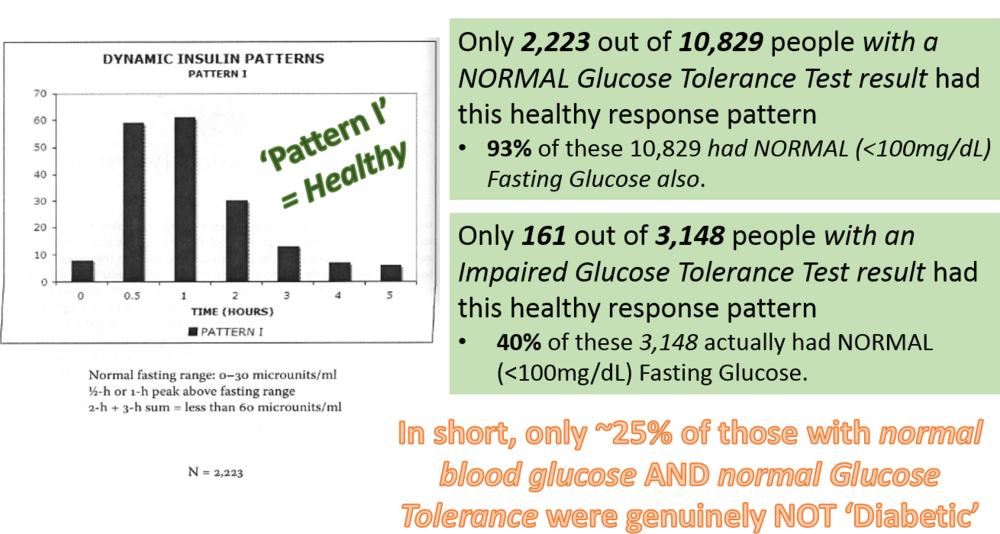
Dr. Kraft properly measured people for Insulin/Diabetic issues – 14,384 of them, ages 3 to 90, over 20 years of proper/accurate ‘5 hour glucose with hourly insulin assays’. He accurately quantified essential Type 2 Diabetes (or not) in each person, and the prevalence was far higher than generally perceived from standard tests (the orthodox increase in T2D can be observed here). For these 16k people, he accurately measured their Insulin response to carbohydrate/glucose load, learning that there were 5 patterns of response. The first response ‘Pattern I’ is healthy or ‘Euinsulin’ as he called it – not many of the poor people achieved this however. Hidden diabetic phenomena far exceeded the levels that would be indicated by the glucose tests. These next 3 response types show different degress of hyperinsulinemia – but as Dr. Kraft realised, ALL of these three responses mean that you are essentially diabetic – he called them ‘Diabetes In-Situ’. When they switched on the high-carb guidelines, they effectively opened up the Hyperinsulemia/Diabetes-In-Situ tap:
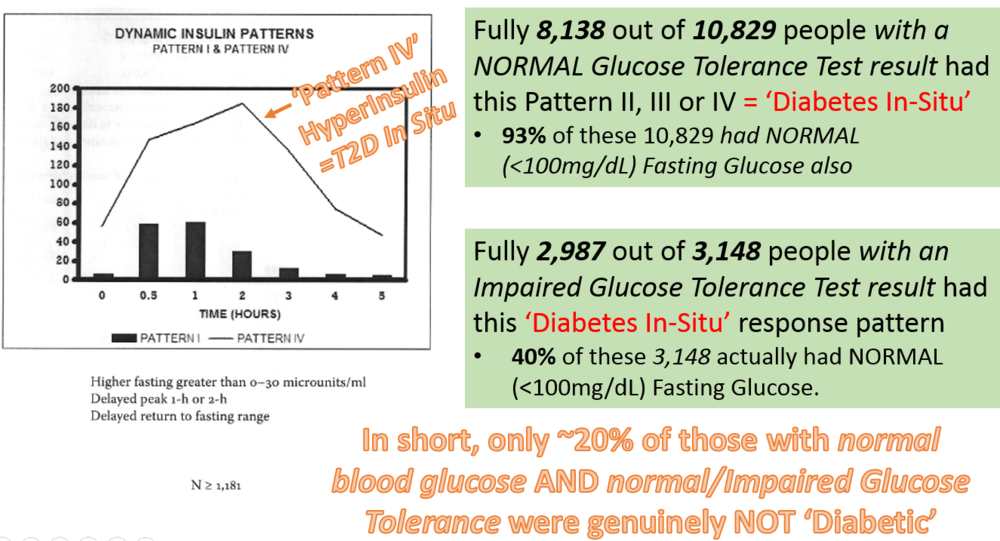
Now we go onto the three inter-related response curves that truly show the person has a hyperinsulinemic or ‘Diabetes In-Situ’ fire inside. Hyperinsulinemia State = Type 2 Diabetes. Also, Type 2 Diabetes = Hyperinsulinemia State. This applies even if you do not fulfill the current T2D indicative criteria (i.e. the majority of those out there who have diabetic vascular distress simmering):

And the third, Type IV HyperInsulin / ‘Diabetes In-Situ’, with some shocking conclusions:
Most of these people would not be identified with Fasting Glucose or even Glucose Tolerance Test. Their Fasting Insulin is a far too noisy variable also – it only gave solid diagnosis when >30 μU/ml. You need to be 3-5 μU/ml to be in safe haven from the fire. And what is the AVERAGE Fasting Insulin for adolescents in the USA these days? A shocking 12 μU/ml. From Dr. Krafts excellent data, they are all playing with fire; quite literally – the ‘fire inside’ of metabolic disease and atherosclerosis – they are strapped in without a brake pedal, unless they back off the carb. Dr. Kraft has stated that the pathology of atherosclerosis IS the pathology of Diabetes, and vice-versa. He maintains that generally the people with substantial atherosclerotic issues who are not diagnosed with diabetes, are simply not properly diagnosed yet. ‘Cholesterol’ is simply a passenger in the vascular vehicle. Unsurprisingly, Diabetics diagnosed by the current methods have around 7 times the risk of atherosclerotic heart disease; as Dr. Kraft clarified, the rest are largely waiting to be diagnosed with diabetic-type issues, although most never will be. What an utter, utter tragic mess of misunderstanding.
For those interested in the final pattern of response, Pattern V, it is captured below – identifies likely Type-1 Diabetics, but can also identify healthy low-carbers, so judgment and expertise is required (!):

To the low carb point above, note the effects on the response curve when he had previously Response III type person (i.e. they were Diabetes In Situ) go on low carb regime – after a short period, they now produced the Pattern V response (lower curve below) – extraordinary stuff:

And some of the data detail I summarized from analyzing Dr. Kraft’s incredible oeuvre:

Read ’em and weep.
As a final shot, Kraft’s theory about properly measured hyperinsulinemia response being the sine qua non of prevalent disease would go towards explaining how the great Gerald M Reaven got this result from splitting a fair, randomly selected group of apparently healthy middle-aged people into three groups (diabetics and other problem peeps removed from the group in advance). The three groups were Low, Medium and High Insulin Resistance. Following them for 6 years resulting in the below outcome – and yes, statistical analysis showed that the Insulin Resistance blew away all of the other biometrics (e.g. BP, ‘Cholesterol’ metrics, etc etc) in terms of direct connection to the disease and death:

Kraft’s explanatory letter to Prof. Grant Schofield page 1 here: http://profgrant.com/2013/08/16/joseph-kraft-why-hyperinsulinemia-matters/unknown-4/ and page 2 here: http://profgrant.com/2013/08/16/joseph-kraft-why-hyperinsulinemia-matters/unknown-1-2/

